I received several e-mails regarding the understanding of the dynamic error
free RBN.
In order to explain this graphically I will use the DR1A case from CQWW CW
2012 on 40 meters.
DR1A was the most spotted station on 40 meters.
DR1A was also busted many times and those busted spots were sent to the RBN
Overall there were 8223 spots coming from the real DR1A on the bands:
8114 DR1A spots
109 bust spots of DR1A with the following occurrences - DR1S (24), NR1A
(15), DR1T (14), IR1A (11), DR1I (8), DM1A (8), DR4A(7), MR1A (4), KR1A
(4), LR1A (3), DR2A (2), DK1AX ( 2), DR1U (2), DD1A (1), DR1AE (1), XR1A
(1), DR1N (1) and HR1A (1)
As you can see RBN skimmers are very "creative" when it comes to busting
good calls. But bear in mind that Skimmer is more accurate than humans.
Humans are even more creative when it comes to busting calls, as can be
seen in CQWW rpt log checking reports.
CT1BOH dynamic error free RBN algorithm catches this dynamic flawlessly.
CT1BOH algorithm output for all these 8223 spots is the following:
Good Call 7643 92.9%
Good call, New Frequency 468 5.7%
DR1A Busts 109 1.3%
?Spots 2 0.0%
Busted 1 0.0%
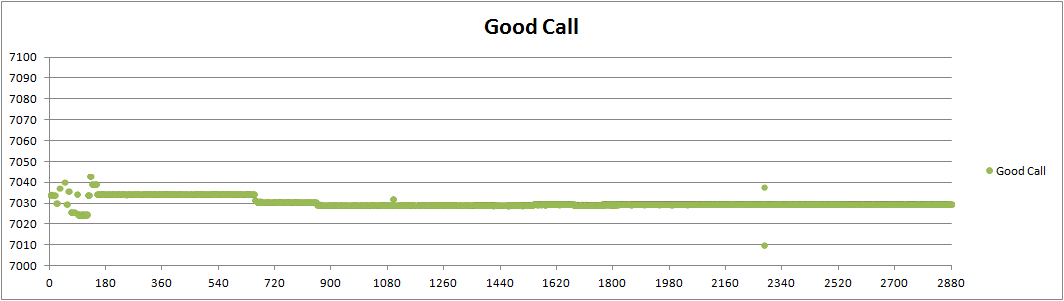
Let's put only the good spots in a graph. Click the links below to see.
http://www.qsl.net/c/ct1boh//dl/good.png
The X axis shows the 48 hours of the contest from minute 1 (00:00 Saturday)
until minute 2880 (23:59 sunday).
The Y axis shows frequency.
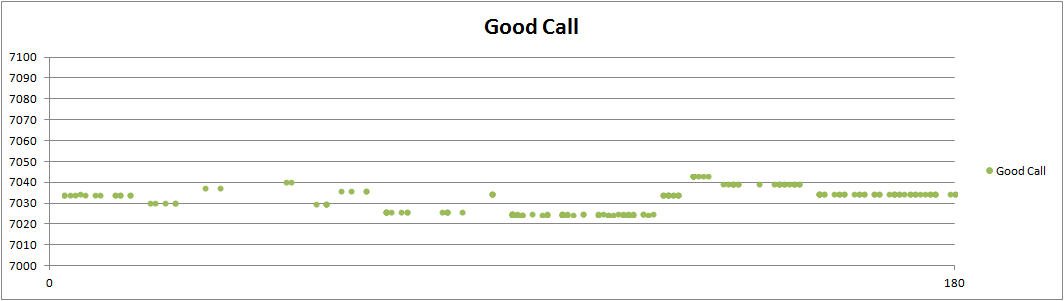
The scattered dots in the first three hours is DR1A trying to find a good
run frequency. If I zoom only for the first three hours this becomes more
clear
http://www.qsl.net/c/ct1boh//dl/first3.png
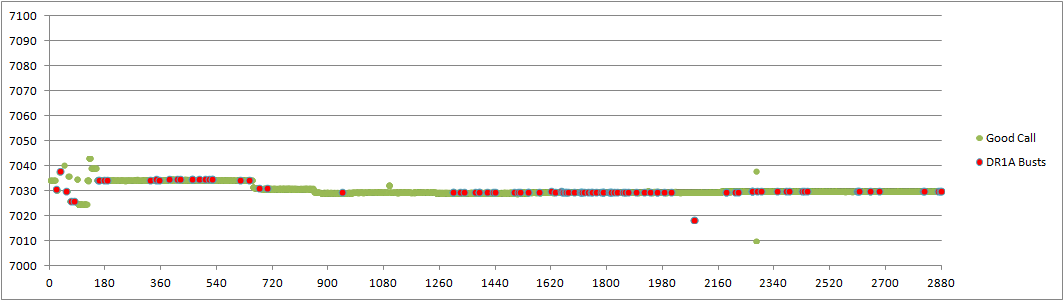
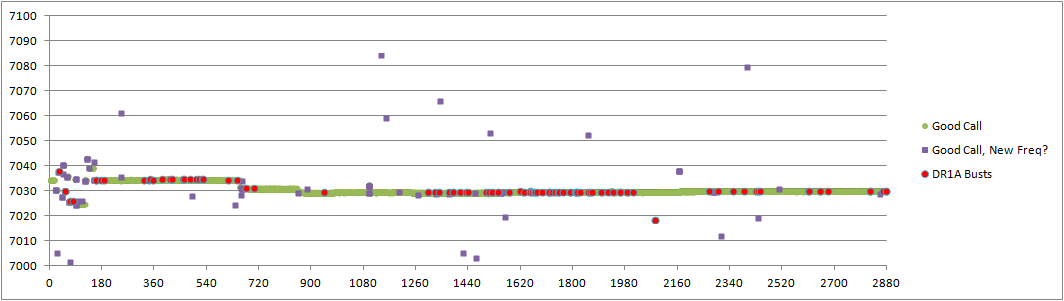
Let's go back to the original graph with the good spots during the 48
hours, and add the 109 DR1A Busts that Skimmers generated
http://www.qsl.net/c/ct1boh//dl/goodandbusts.png
CT1BOH algorithm catches all the busted spots and can filter them out of
the network
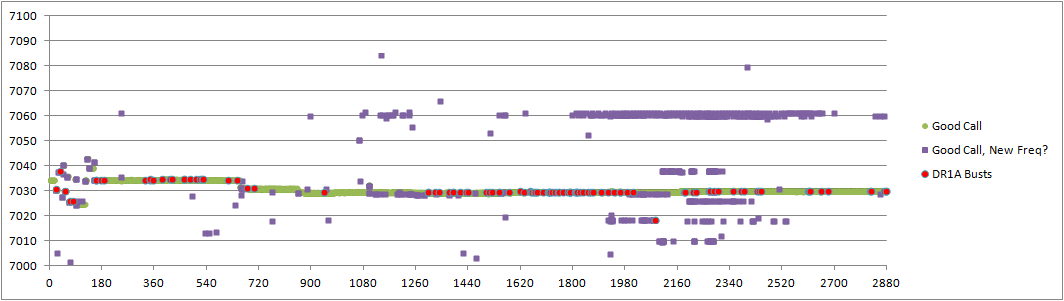
Let's now add to the graph the "Good call, New frequency?" spots. By now
you know that these spots are the first and the second spots when a new run
frequency is established (these are good spots - I know they were 49 spots
out of the 468) and the true bad frequency spots from uncalibrated skimmers
(I know they are 419 spots)
http://www.qsl.net/c/ct1boh//dl/goodbustgnf.png
Let's just go a bit deeper in this graphical analysis.
Where are all these bad frequency spots coming from?
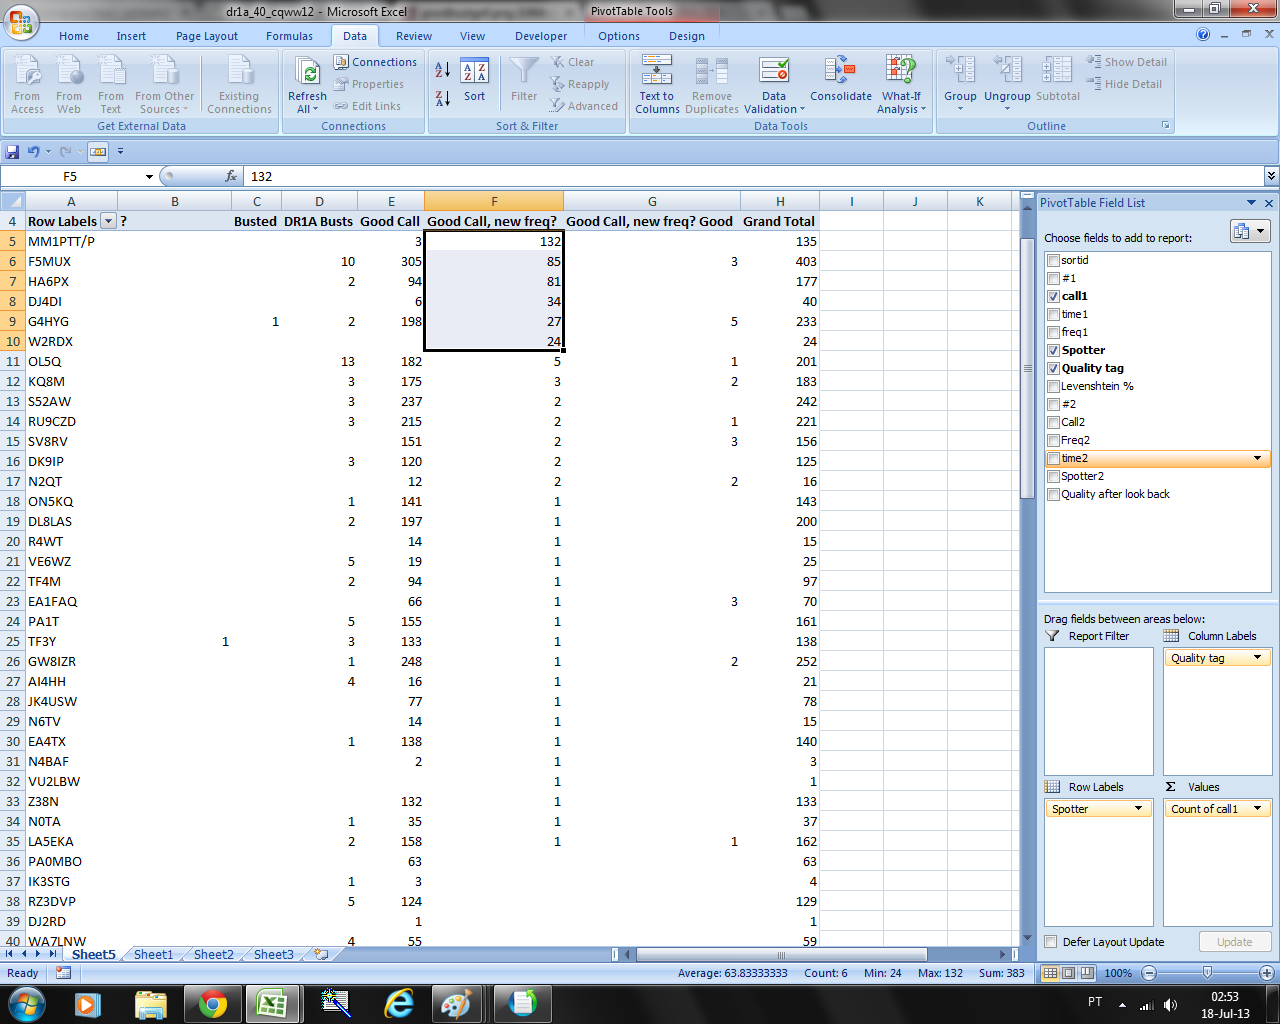
93 different skimmer from around the world spotted DR1A or busted DR1A call.
But not all of them were uncalibrated.
http://www.qsl.net/c/ct1boh//dl/skimmers.png
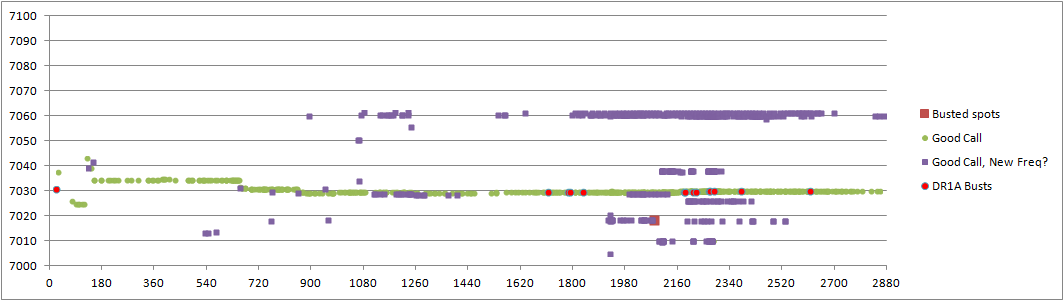
If I remove from the graph the six uncalibratted skimmers (MM1PTT/P,
F5MUX, HA6PX, DJ4DI, G4HYG, W2RDX)
The graph goes from this http://www.qsl.net/c/ct1boh//dl/goodbustgnf.png
into this http://www.qsl.net/c/ct1boh//dl/remove6skimmers.png
Amazing isn't it. Just removing six uncalibratted skimmer makes a huge
difference.
One final graph. If we now look at all the spots from those six skimmers
http://www.qsl.net/c/ct1boh//dl/datafrom6skimmers.png
we clearly see, that they still produce a lot of good spots. They just have
to fix that IQ image N4ZR explained in his post.
Until then the dynamic error free RBN algorithm will easily filter them out
on the spot.
By now, I hope I have explained how effective a dynamic free RBN algorithm
works.
This algorithm is so effective because the network is so big that the good
spots will always outnumber the bad spots.
Also I would like to explain the price of running this algorithm
The price is the first two good spots in a run until the third comes to
validate it is a good call.
In the case of DR1A the price is 49 spots that are filtered out so that we
can drop 520 bad spots
Because the network is so big, this price is negligible, i.e. even if we
drop the first two spots of a run, chances are that the third spot will be
in the same minute.
To answer UA9CDC:
Parasitic AM Modulation will be much less spotted that the good signal. The
good signal will outnumber them, and since they are +/- 1.5 KHz away they
will be dropped as "Good call, New Freq?" spot
Second and third harmonic will be spotted as good, just like they are
today. These are very, very, insignificant cases in the overall number of
spots. The algorithm could be enhanced to try to predict these cases, but I
don't advice doing it. I'd rather have a false positive than a false
negative.
No problem with MM stations. The algorithm runs per band. My code was just
for one band for demonstration purposes.
I understand VE7CC-1 just implemented his version of the dynamic erro free
RBN. Also I understand N1MM and AR cluster is also implemented.
Soon, busted spots ans wrong frequency spots will be a thing of the past
from this extraordinary tool - Reverse Beacon Network
73 José Nunes
CT1BOH
--
José Nunes
CONTEST CT1BOH - http://www.qsl.net/ct1boh
_______________________________________________
CQ-Contest mailing list
CQ-Contest@contesting.com
http://lists.contesting.com/mailman/listinfo/cq-contest
|